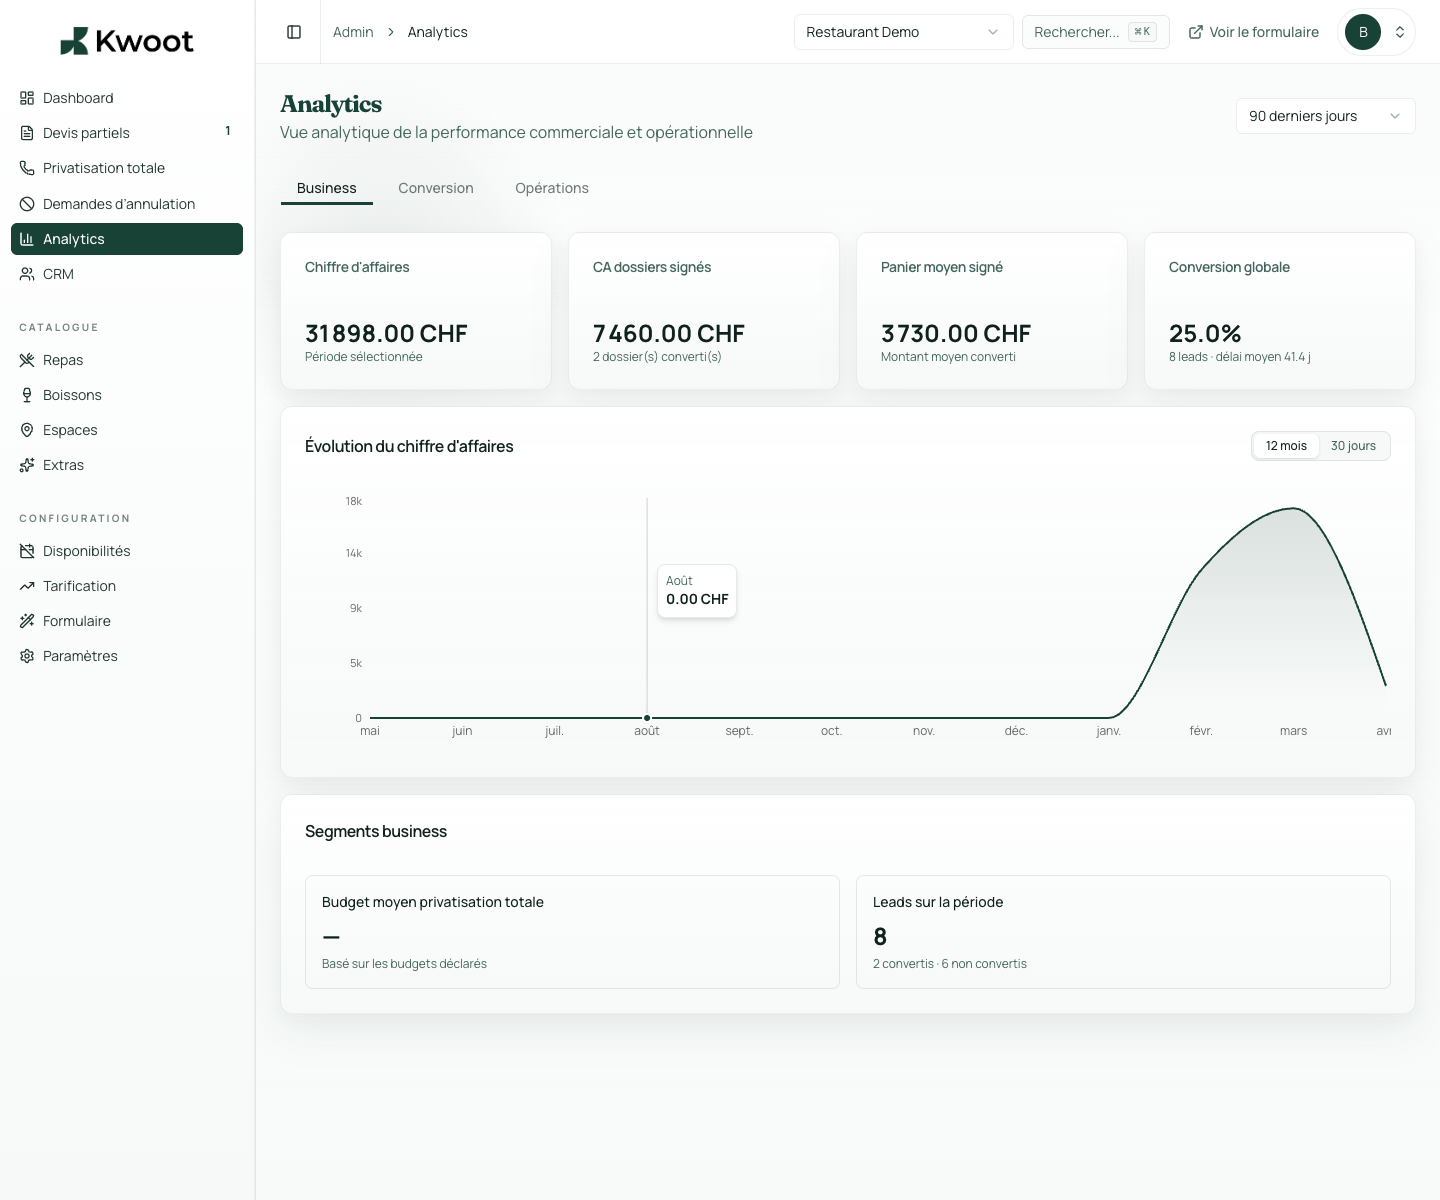
The dashboard displays the numbers that are really used to track activity: revenue by period, average basket, conversion time, most requested menus, most requested spaces and quote wizard abandonment.
Key figures & reporting
How much is your events business really worth? The answer is in Kwoot.
Signed quotes, revenue per period, average basket, best-selling menus, files to follow up: the Kwoot dashboard gives useful figures to decide what to adjust.
Less back and forth with your customers
A clear file for your team
More quotes ready to sign
What it unlocks
Everything you need to convert more opportunities.
The rolling 12-month revenue chart gives you a clear view of the trend. Identify your high season peaks, compare years and spot low months.
Kwoot numbers go beyond overall revenue. You see the performance of each element of your offer: formulas, extras, spaces and impact on your revenue.
The metrics that matter
No numbers to make it look pretty. Useful figures to decide.
The dashboard displays the numbers that are really used to track activity: revenue by period, average basket, conversion time, most requested menus, most requested spaces and quote wizard abandonment.
Income and trends
Has your events activity progressed this year?
The rolling 12-month revenue chart gives you a clear view of the trend. Identify your high season peaks, compare years and spot low months.
Commercial performance
Which menu sells best? Which space is the most profitable?
Kwoot numbers go beyond overall revenue. You see the performance of each element of your offer: formulas, extras, spaces and impact on your revenue.
Kwoot makes this step clearer for the team and more professional for the client: everyone knows what to do, where to look and when to restart.
Example of a situation handled with KwootWhat you don’t measure, you can’t improve.
The Kwoot dashboard gives you the data to make better business decisions about your events business.
FAQ
Frequently asked questions about key figures & reporting
Are the figures updated in real time?
Yes. The dashboard is updated whenever a quote changes status.
Can we export the data?
Yes. The data can be exported as CSV for external analysis.
Do the figures cover all types of status?
Yes. You can filter by status to analyze each stage of the funnel.
Is there any behavior data in the quote wizard?
Yes. The quote wizard's step-by-step abandon rate is available to identify where clients are blocking.
See also